| |
Welcome to the | |
| |
AACES-1 Project | |
| Australian Airborne Cal/val Experiment for SMOS |
|
Home page
Google Earth (KML file) Workplan SMOS AMSR-E WindSat ASCAT PALSAR ASAR MODIS MTSAT-1R ASTER Landsat CHRIS AVNIR-2 PLMR data Thermal Infrared data Multi-Spectral data Monitoring stations Soil moisture sampling Vegetation sampling Roughness sampling Campaign shapefiles DEM Land use Climate data Rainfall data Soil classification Soil water capacity Soil texture analysis AACES homepage Moisturemap homepage |
Monitoring StationsIn addition to the available permanent soil moisture monitoring network provided by OzNet (purple dots in figure below), supplementary temporary monitoring stations have been installed during the AACES-1 campaign. 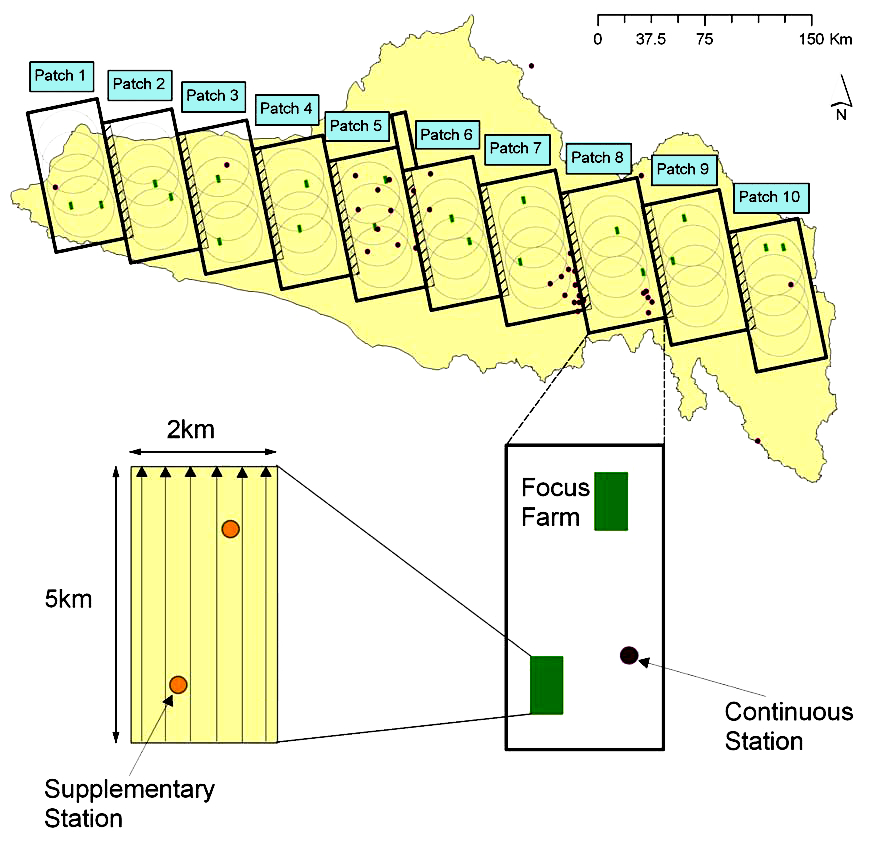 Schematic of the temporary monitoring station network
Due to limited equipment, the supplementary stations were moved across the study transect, with monitoring stations set up during the teams site reconnaissance, which was scheduled at least the day before the actual airborne observation of the focus farm. These short-term monitoring stations have been instrumented with a raingauge, thermal infrared sensor, leaf wetness sensor (MEA LWS v1.1), two soil moisture sensors (Delta-T Thetaprobes; 0-5cm and 20-25cm) and four soil temperature sensors (MEA6507A; 2.5cm, 5cm, 15cm and 40cm depth) in order to provide time series data during the sampling period.  Schematic of the general temporary monitoring station setup
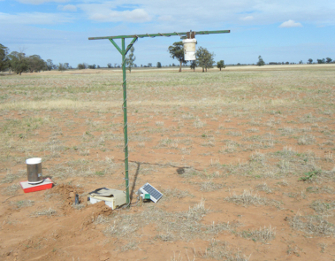 Northern monitoring station at P07F13_St25.
Such measurements can be used for identifying the presence or absence of dew, and verifying the assumptions that i) effective temperature has not changed throughout the course of the aircraft measurements; ii) vegetation and soil temperature are in equilibrium; and iii) soil moisture has not changed significantly during ground sampling. The details and an example of a supplementary monitoring station in the focus farm transect are indicated above. The location of Supplementary Monitoring StationsThe locations of all supplementary monitoring stations per patch are shown below. By clicking the icon of an individual monitoring station, photographs of the site and plots of the measured data can be browsed. In order to download the collected data please go to the Download Centre. Patch 01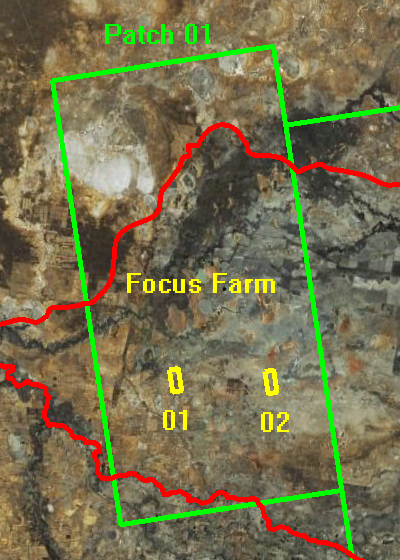 Patch 01 Patch 01Source: GoogleEarth, accessed on 2nd, May 2010.  Source: GoogleEarth, accessed on 3rd, May 2010. 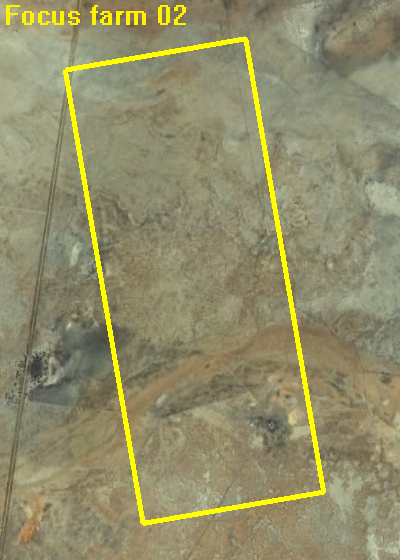 Source: GoogleEarth, accessed on 3rd, May 2010. Patch 02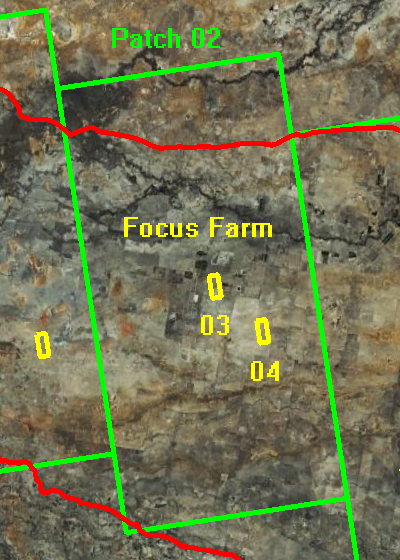 Patch 02 Patch 02Source: GoogleEarth, accessed on 2nd, May 2010.  Source: GoogleEarth, accessed on 3rd, May 2010. 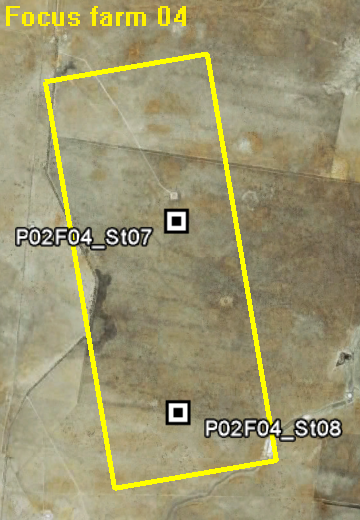 Source: GoogleEarth, accessed on 3rd, May 2010. Patch 03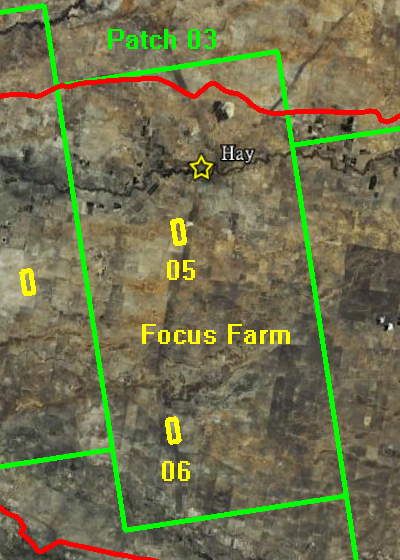 Patch 03
Source: GoogleEarth, accessed on 2nd, May 2010. 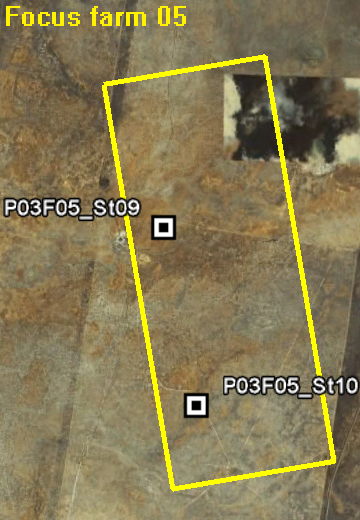 Source: GoogleEarth, accessed on 3rd, May 2010. 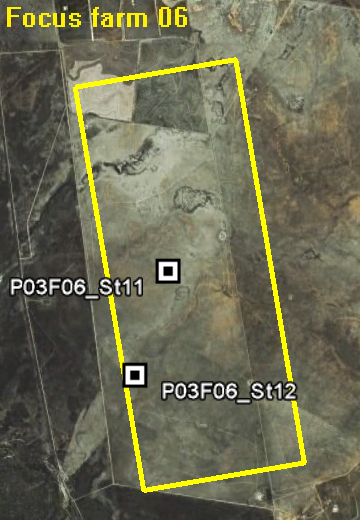 Source: GoogleEarth, accessed on 3rd, May 2010. Patch 04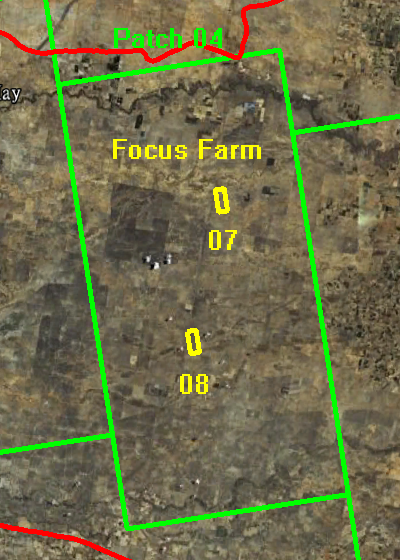 Patch 04
Source: GoogleEarth, accessed on 2nd, May 2010. 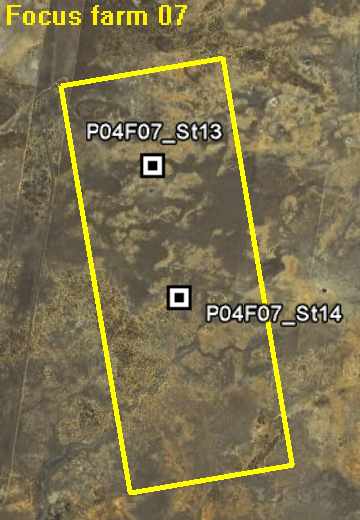 Source: GoogleEarth, accessed on 3rd, May 2010. 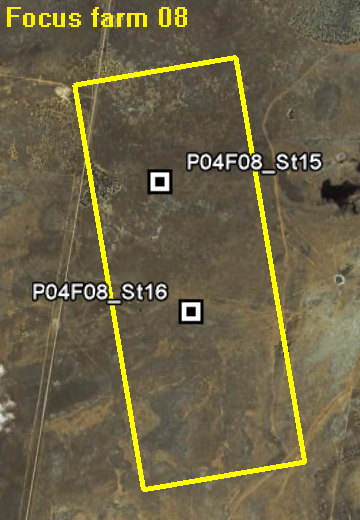 Source: GoogleEarth, accessed on 3rd, May 2010. Patch 05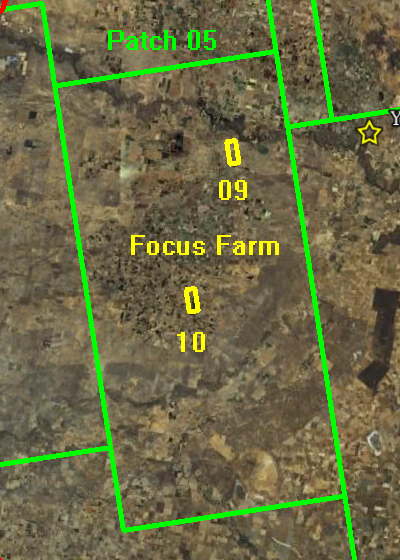 Patch 05
Source: GoogleEarth, accessed on 2nd, May 2010. 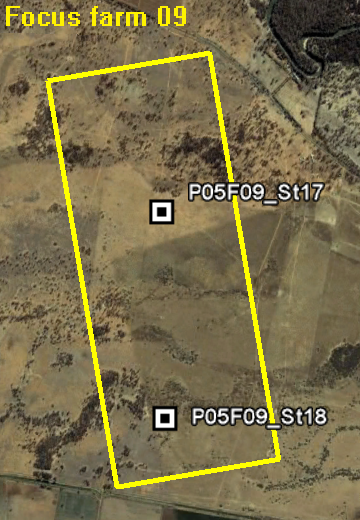 Source: GoogleEarth, accessed on 3rd, May 2010. 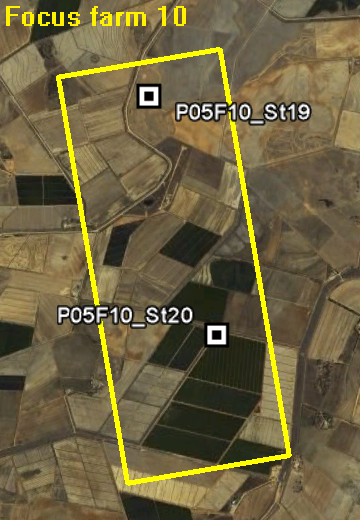 Source: GoogleEarth, accessed on 3rd, May 2010. Patch 07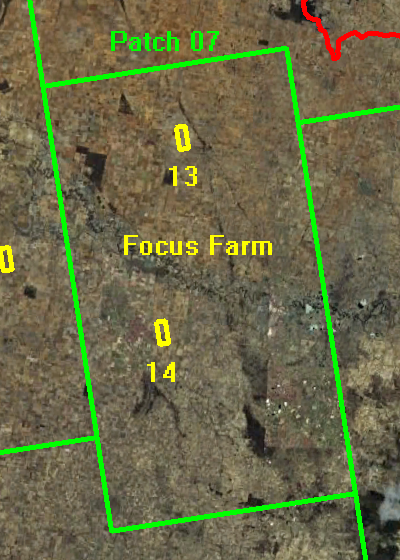 Patch 07 Patch 07Source: GoogleEarth, accessed on 2nd, May 2010. 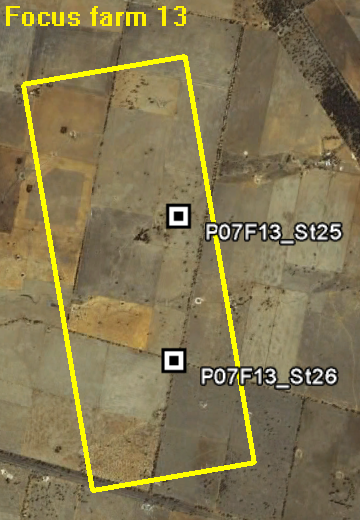 Source: GoogleEarth, accessed on 3rd, May 2010.  Source: GoogleEarth, accessed on 3rd, May 2010. Patch 08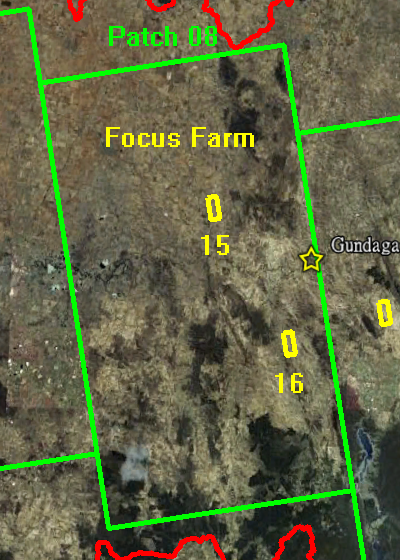 Patch 08 Patch 08Source: GoogleEarth, accessed on 2nd, May 2010. 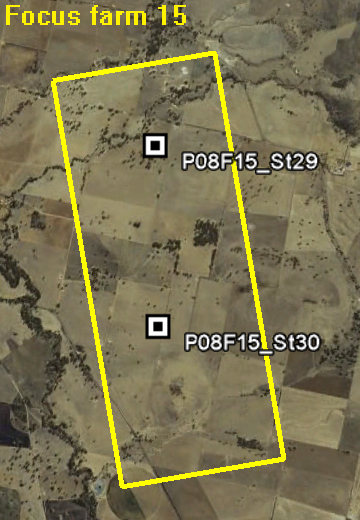 Source: GoogleEarth, accessed on 3rd, May 2010.  Source: GoogleEarth, accessed on 3rd, May 2010. Patch 09 Patch 09 Patch 09Source: GoogleEarth, accessed on 2nd, May 2010. 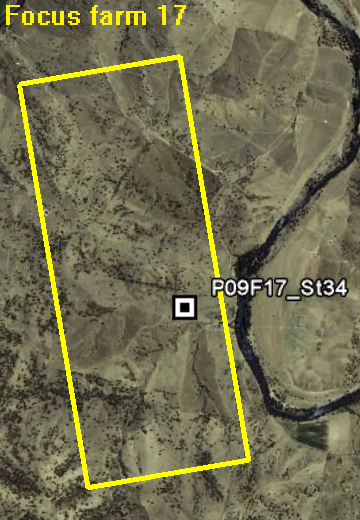 Source: GoogleEarth, accessed on 3rd, May 2010. 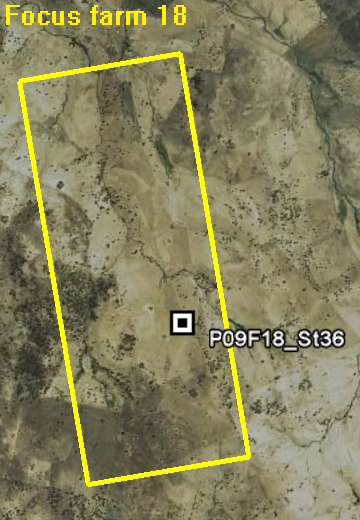 Source: GoogleEarth, accessed on 3rd, May 2010. Patch 10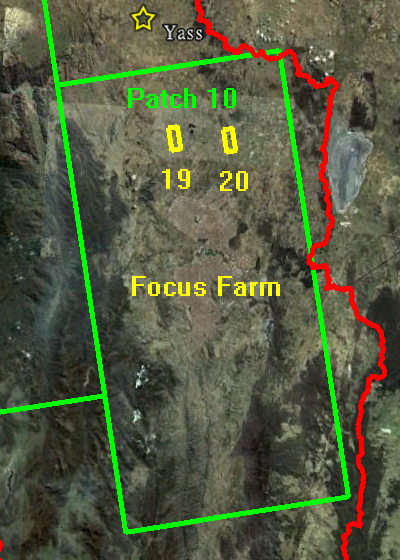 Patch 10 Patch 10Source: GoogleEarth, accessed on 2nd, May 2010. 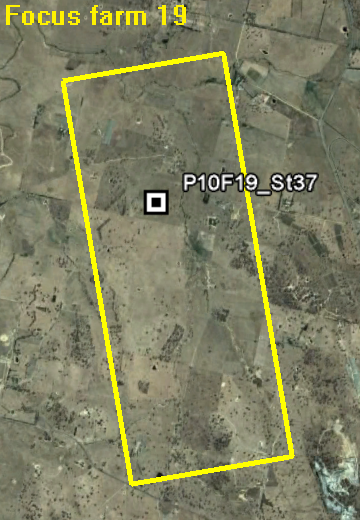 Source: GoogleEarth, accessed on 3rd, May 2010.  Source: GoogleEarth, accessed on 3rd, May 2010. |
|
Created: January 2010 Last Modified: August 2010 Maintainer: YE Nan, Ye.Nan@monash.edu |